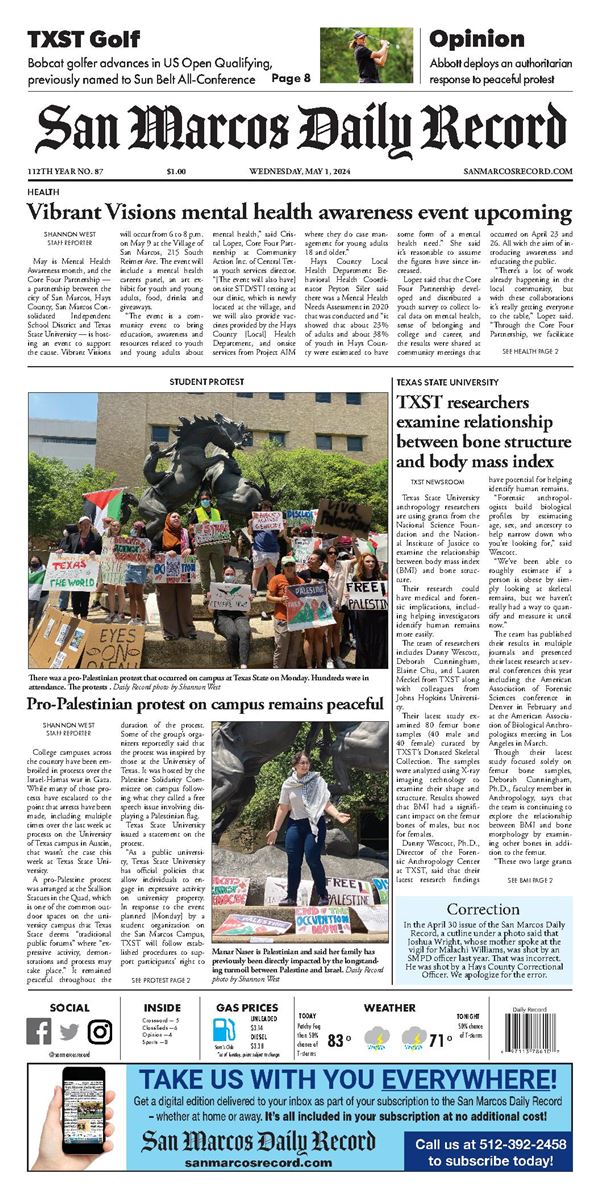

In February, the median home price across the Austin-Round Rock-San Marcos MSA fell 3.9% year-over-year to $430,000, according to the latest Central Texas Housing Report released by Unlock MLS. While closed sales in the MSA dipped 6.5% yearover- year to 1,856 sales, rising inventory – up to 5.7 months of inventory –– indicates growing opportunities for buyers heading into the spring homebuying season. In the leasing market, supply increased to 2.3 months of inventory, driving a 2.4% drop in median rent to $2,195.
Clare Knapp, Ph.D., housing economist for Unlock MLS and the Austin Board of REALTORS , noted that while elevated mortgage rates and affordability challenges have factored into the decline in sales, sellers are lowering prices to attract buyers, helping to further stabilize the market.
“As affordability remains a key constraint for many first-time homebuyers, the single-family leasing market continues to be a viable alternative. While closed sales have slowed this month, sellers adjusting their pricing strategies to align with market conditions are keeping transactions moving. With inventory levels rising, buyers are regaining leverage, creating a more favorable environment for those who have been waiting for the right moment to purchase. Mortgage rates are expected to remain elevated this year, which may not bring significant relief to buyers, but will provide more predictability, allowing both buyers and sellers to navigate the market with clearer expectations. As we head into the traditionally busy spring homebuying season, increased options and improved pricing flexibility could encourage more buyers to transition from renting to homeownership.”
Brandy Wuensch, 2025 Unlock MLS and ABoR president, highlighted the value of working with an Unlock MLS professional agent to navigate the decisions between leasing and buying.
“Transparent data and market insights are key for clients navigating today’s housing market – whether buying, selling or renting. With both the leasing and for-sale markets experiencing a decline in median prices and increased supply, professional agents play a critical role in helping clients capitalize on market shifts. Sellers must price competitively to attract buyers in an evolving landscape, while buyers have a growing number of opportunities to explore as market conditions continue to adjust. In this dynamic environment, expert guidance is key to making informed, strategic decisions.”
AUSTIN-ROUND ROCK-SAN MARCOS MSA February 2025 - For Sale
• 1,856 – Residential homes sold, 6.5% less than February 2024.
• $430,000 – Median price for residential homes, 3.9% less than February 2024.
• 3,826 – New home listings on the market, 6.5% more than February 2024.
• 10,235 – Active home listings on the market, 16.7% more than February 2024.
• 2,452 – Pending sales, 5.0% less than February 2024.
• 5.7 – Months of inventory, 1.3 months more than February 2024.
• $1,055,114,766 – Total dollar volume of homes sold, 4.9% less than February 2024.
• 93.5% – Average close to list price, compared to 93.6% in February 2024.
February 2025 - For Lease
• 1,751 – Closed leases, 4.0% less than February 2024.
• $2,195 – Median price for rent, 2.4% less than February 2024.
• 2,036 – New lease listings on the market, 2.0% less than February 2024.
• 3,899 – Active lease listings on the market, 3.5% more than February 2024.
• 1,977 – Pending leases, 6.5% more than February 2024.
• 2.3 – Months of inventory, 0.3 months more than February 2024.
• $4,352,657 – Total dollar volume of leases, 6.2% less than February 2024.
• 96.4% – Average close to list price, compared to 96.0% in February 2024.
HAYS COUNTY February 2025 - For Sale
• 262 – Residential homes sold, 7.5% less than February 2024.
• $359,000 – Median price for residential homes, 6.8% less than February 2024.
• 562 – New home listings on the market, 12.2% more than February 2024.
• 1,627 – Active home listings on the market, 16.9% more than February 2024.
• 378 – Pending sales, 6.5% more than February 2024.
• 6.4 – Months of inventory, 1.9 months more than February 2024.
• $115,844,736 – Total dollar volume of homes sold, 15.6% less than February 2024.
• 92.9% – Average close to list price, compared to 93.3% in February 2024.
February 2025 - For Lease
• 181 – Closed leases, 8.1% more than February 2024.
• $2,000 – Median price for rent, 4.8% less than February 2024.
• 194 – New lease listings on the market, 9.6% more than February 2024.
• 389 – Active lease listings on the market, 25.1% more than February 2024.
• 209 – Pending leases, 24.4% more than February 2024.
• 2.2 – Months of inventory, 0.4 months more than February 2024.
• $394,125 – Total dollar volume of leases, 4.5% more than February 2024.
• 96.8% – Average close to list price, compared to 96.3% in February 2024.
TRAVIS COUNTY February 2025 - For Sale
• 852 – Residential homes sold, 4.1% less than February 2024.
• $515,000 – Median price for residential homes, 2.2% more than February 2024.
• 1,863 – New home listings on the market, 4.2% more than February 2024.
• 4,793 – Active home listings on the market, 11.7% more than February 2024.
• 1,109 – Pending sales, 6.3% less than February 2024.
• 5.8 – Months of inventory, 1.5 months more than February 2024.
• $604,446,524 – Total dollar volume of homes sold, 2.7% more than February 2024.
• 93.2% – Average close to list price, compared to 93.4% in February 2024.
February 2025 - For Lease
• 900 – Closed leases, 12.2% less than February 2024.
• $2,299 – Median price for rent, 4.2% less than February 2024.
• 1,118 – New lease listings on the market, 3.5% less than February 2024.
• 2,291 – Active lease listings on the market, 1.9% less than February 2024.
• 1,009 – Pending leases, 1.9% less than February 2024.
• 2.6 – Months of inventory, 0.4 months more than February 2024.
• $2,488,527 – Total dollar volume of leases, 13.3% less than February 2024.
• 96.2% – Average close to list price, compared to 95.5% in February 2024.
CALDWELL COUNTY February 2025 - For Sale
• 25 – Residential homes sold, 11.7% less than February 2024.
• $276,990 – Median price for residential homes, 9.2% less than February 2024.
• 43 – New home listings on the market, 41.9% less than February 2024.
• 154 – Active home listings on the market, 7.7% more than February 2024.
• 27 – Pending sales, 30.8% less than February 2024.
• 6.4 – Months of inventory, 1.9 months more than February 2024.
• $7,619,523 – Total dollar volume of homes sold, 30.0% less than February 2024.
• 92.4% – Average close to list price, compared to 92.7% in February 2024.
February 2025 - For Lease
• 19 – Closed leases, 76.2% more than February 2024.
• $1,800 – Median price for rent, flat compared to February 2024.
• 23 – New lease listings on the market, 9.5% more than February 2024.
• 29 – Active lease listings on the market, 9.4% less than February 2024.
• 22 – Pending leases, 340.0% more than February 2024.
• 1.5 – Months of inventory, 1.4 months less than February 2024.
• $34,910 – Total dollar volume of leases, 74.9% more than February 2024.
• 96.8% – Average close to list price, compared to 95.3% in February 2024.
• For more information or to download the February 2025 Central Texas Housing Market Report, visit UnlockMLS.com/Stats.
Unlock MLS marks the intersection of knowledge, humanity, and home. For nearly 60 years, we’ve fostered the most complete, accurate, timely, and reliable real estate marketplace for the 18-county Central Texas region. In partnership with the 18,000 real estate professionals who power our MLS, we lead the industry in transparency, data integrity, and a people-first focus to make home buying, selling, and renting accessible and attainable for all. For more information, visit UnlockMLS.com.